Large-Scale Hypervisor Monitoring
This project is a large-scale distributed set of scripts designed for true hypervisor monitoring, data collection, and presentation. You can reliably monitor tens of statistics, for hundreds of hypervisors, for thousands of virtual guests. They work directly with Zabbix, a third-party application designed for Data Centres, and can present the graphical data in modern browsers independently, with interactive zoom/query controls.
Zabbix claims to have hypervisor monitoring, but it cannot natively monitor hypervisors like Xen without installing an agent inside the guest systems. My extensions to Zabbix have no such limitation. That means even if a customer erases the operating system and replaces it, monitoring still works.

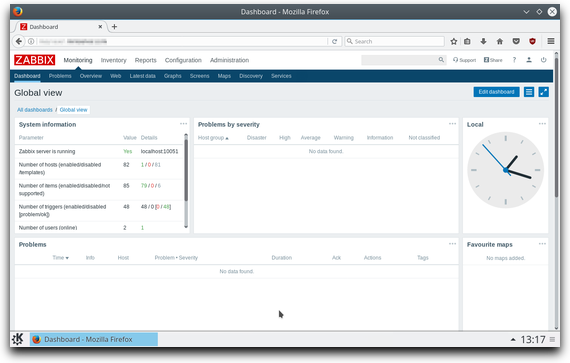
Zabbix, the third-party software receiving the data
The scripts are lightweight, but they could only have been written by someone who has a deep understanding of:
- A Data Centre’s infrastructure
- Hypervisors (like Xen)
- Integration with, and extending complex third-party software (like Zabbix)
- Writing software that can scale up massively
Note that there are various other tasks I had to do with Zabbix to get this to work too.
I developed it from scratch in just a couple of days. My developer colleague kindly approved it, and then it was handed to the Operations Team for distribution across the Data Centre.
The project improved the Customer Control Panel, monitored/alerted about system problems or abuse, and made staff lives easier.
What it Does
The monitoring script is extremely efficient. There is:
- A wealth of information and statistics on guest (customer) servers, nearly ‘for free’.
- No need to install anything on guest servers, and host servers just need the monitoring script.
- Negligible impact on RAM.
- Almost no disk space requirement.
- Usually under 1KB/minute of network I/O per host server.
- Proper support for daemonisers, e.g. systemd or supervisord.
- Detailed debug logging.
Tens of thousands of virtual servers can have, at the very least, disk I/O, network I/O and each vCPU monitored on a per-minute basis. This, monitored over a short period, can give you reliable, and almost immediate alerts, such as when someone is using a BitCoin miner on a virtual server, which negatively impacts other customers and usually results in complaints as excessive ‘CPU Steals’ start to occur over a large timeframe.
The monitoring script directly communicates with the host’s hypervisor and, in theory, can analyse live disk contents, even whilst a server is running and changing the disk.
Discovery
Usually discovery is done on set intervals, but not in this case. The monitoring script runs all the time, so it discovers changes as it runs, and pushes additional updates to Zabbix proxies as-and-when ‘hypervisor domains’ appear and disappear. Additionally, discovery of domains is sent at the beginning, and (by default) after 10-minute intervals.
Data Synchronisation
The monitoring script waits for a random time, between 0 seconds and the configured update interval. This is, quite simply, to ensure that collisions are unlikely to occur if multiple host servers in the Data centre are booted at once.
Data is sent in blocks. The entire process of sending the data and receiving acknowledgement is usually under 10 milliseconds for all the guests on a host.
Multi-Threaded Operation
The monitoring script is multi-threaded, mainly to ensure there is no need to interrupt real-time monitoring to send updates. Proper signalling and inter-thread data exchanges are done through an asynchronous queue.
Configurability
The monitoring script picks up the standard Zabbix agent config and uses that. If you’re not using the agent, you still only need to put the appropriate config file in ‘/etc’.
You can configure the update intervals, the forced discovery intervals, and the timeouts for data analysis and sending.
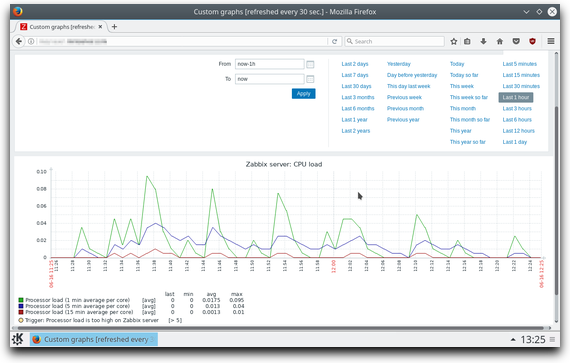
In Zabbix itself, predictive algorithms can be used to produce alerts. ‘Priority 1′ alerts can be sent directly via SMS for immediate attention. You can see graphs similar to this, but of course with lots more detail appropriate to hypervisors:

Zabbix, showing basic local CPU performance statistics
