3D Treemaps
If you’ve ever used specialised software to view storage space, you may have seen ‘Treemaps‘ without knowing that’s what they are. They are perhaps the most useful representation you can get of a filesystem, since they show blocks of usage represented as clear rectangles. They are also sometimes used for the stock market or anything else the algorithm is suitable for.
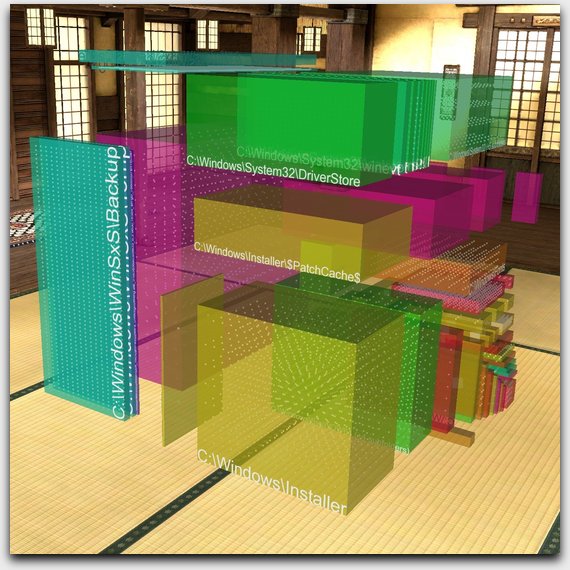
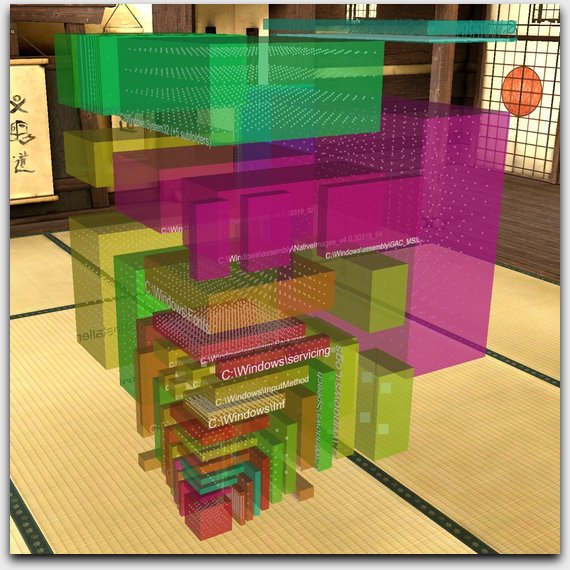
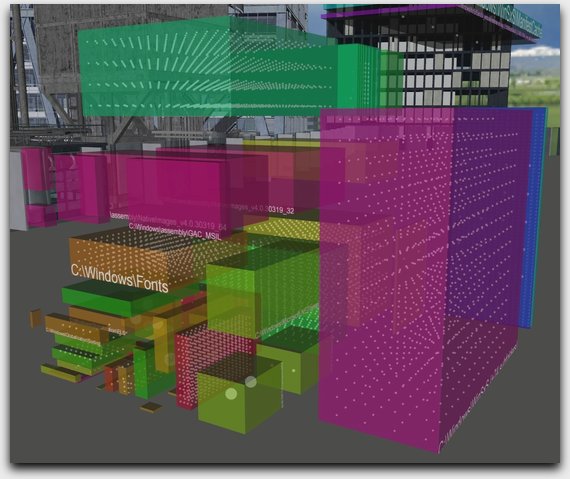
If you’ve ever wondered how Treemaps look if you were to extend that algorithm into a 3rd dimension — and I’m not talking about ‘pseudo 3D’ or ‘2.5D‘ that just adds height as the 3rd axis — this is what you see:


The blocks ‘animate’ out from the centre of the cube as they are shown. Depths are limited so cubes do not get too small to see — any cubes that are tiny get added into an ‘All Others‘ cube. The white dots indicate files in that folder.
You can walk through the shapes and click on the cubes themselves to interrogate subfolder contents; which then produces a further map of that folder.
Treemaps have to summarise the data entirely before they can display anything, unless they’re prepared to constantly re-render the image. Blocks are subdivided horizontally and vertically depending on what is ‘using the most’, and colour is added to represent groups. Usually it is a good idea to keep the blocks ‘square’ if possible, that way you don’t end up with slithers (blocks that are almost invisible due to being too thin or tall).
Note that this software was written for a previous employer, which means I do not hold the licence, and cannot sell it myself.
