Internet Protocol Blocks
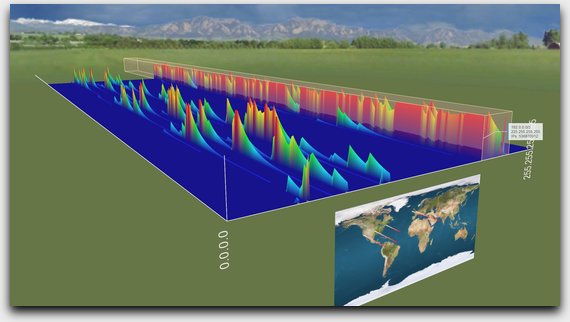
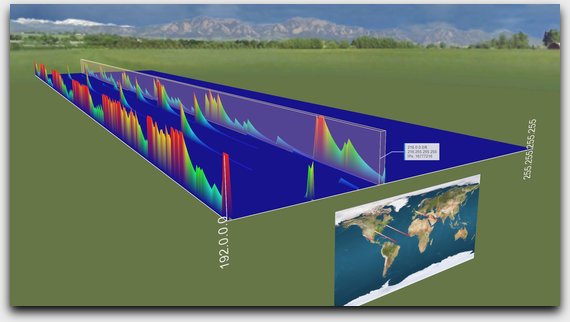
This program has the capability of working out and visualising ‘IP blocks’ by analysing network traffic. An IP addresses is your ‘unique address’ on the Internet. Usually you just have the one if you’re with a regular, home, Internet Service Provider. However, larger companies and corporations can purchase hundreds of IP addresses from higher authorities. You can see who owns these blocks in this software. IP blocks are usually ‘powers of two’, e.g. 1, 2, 4, 8, 16 in size, and so on. Sometimes the blocks are split up, but if so, usually they are ‘close’ together, contained in another ‘power of two’:

In this scenario you can easily see which ‘IP blocks’ are producing the most data traffic, as the spikes are closer together. Lots of network activity is going on in the background to various locations. You can also see a geographic location of where each IP address is (such as San Francisco from Google searches or DNS lookups). In tests, the WHOIS lookup almost always matched the ranges seen on the graph!

This is different to seeing ‘IP ranges’ from a simple, single, WHOIS lookup, since it represents a subdivision of the Internet rather than a simple ‘span of one number to another’. Also, if you were ever unsure what ‘subnet masks’ or ‘CIDR’ were, you would know what they mean after using it, since they are effectively what you are viewing!
Note that this software was written for a previous employer, which means I do not hold the licence, and cannot sell it myself.
