Realtime Graphing
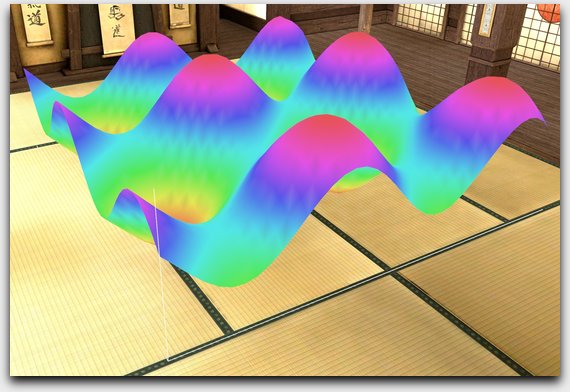
This is an example of fast realtime 3D rendering of graph data. The data is not pre-rendered, it is calculated and is drawn as you see it, as optimised Open GL objects. Normally rendering dynamic, realtime shapes like these gets exponentially slower the more points you add in both the X and Y (or Z) axis, and the data is not often interactive. In this scenario, the data actually ‘exists’ in the world as proper objects and you can even walk about on the top of the graphs, or put shapes (like spheres) on top of them, and watch them move around as the graph changes:

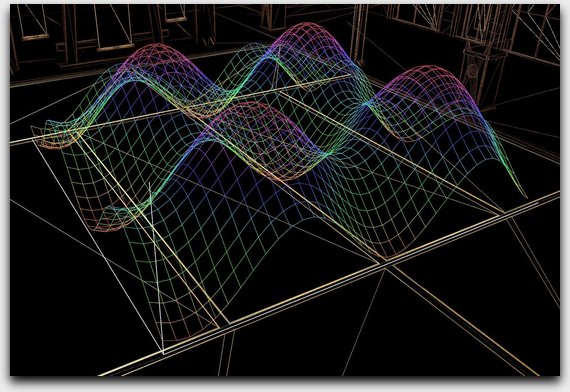
You can also see the graphs as wireframe:

Note that this software was written for a previous employer, which means I do not hold the licence, and cannot sell it myself.
